By Ajay Patel
Fatigue’s been around forever. Players naturally get tired. The running, defensive movements, and intensity of basketball catch up to you. Even the best athletes in the world can’t avoid it. Take Jayson Tatum, Boston Celtics superstar, for example. In the Celtics playoff series against the Milwaukee Bucks this year, Tatum looked gassed as the series progressed and it showed in his shotmaking. However, our current algorithm at ShotQuality would show that a three that Tatum took when tired would have a similar expected value to one he took when he had fresher legs. In the second game of the series, Tatum took a three with an expected value of 1.26, his first shot of the game, and he nailed it. In game seven though, Tatum took a three with an expected value of 1.27, wide open but he missed it. What gives? This was his fourteenth shot of the game, coming in the fourth quarter of a bruising battle. Granted, Tatum could have easily made this shot, but it was much more likely our probabilities needed to be adjusted given the number of shots he had taken and fatigue experienced. To quantify this idea, three main metrics were created: shotQuality over expected, points over expected, and fatigue over expected.
The first step in this process was to check how shot quality changes by a player’s shot number. If fatigue exists, a player’s fifteenth shot should typically be of lower quality than his first shot.

While the margins are low, there is a clear decrease in shot quality as a player takes more shots. Perhaps more importantly, it matches our intuition – people get tired. However, this analysis still had many factors that needed to be controlled for. Namely, a player’s shot diet was a big factor. Everyone experiences some level of fatigue, but are certain players bound to fatigue more than others? How does a three-point shooter fatigue compare to a rim-running center? Other factors include how a player was defended, the type of shot they took, and of course, the shot number. Training these variables against a player’s shot quality and actual points allowed for the creation of Shot Quality over expected, and points over expected. The former metric is meant to capture the looks a player generates as he fatigues, with the latter analyzing how his shotmaking ability changes. And lastly, a composite of these two was created, fatigue over expected.
With the metrics created, the next step to take was a sanity check of sorts. First, how each metric’s value changed by shot number was analyzed. Confirming a fatigue fall-off was reflected in the metrics was necessary.

As seen in the above visualization, each metric does experience a fall-off as a player’s shot number increases. Shot quality over expected actually withstands that fall-off much stronger than the other two metrics, which likely has to do with players taking on large workloads are usually stars, and stars generate good looks. Nonetheless, having confirmed that the fatigue metrics actually represent, well, fatigue, moving onto the actual players was the next step.
Did the leaders in fatigue over expected actually withstand fatigue better than others? After seeing names like Rudy Gobert, Jarrett Allen, and Duncan Robinson, the data was validated. It tracks that players taking easier shots at the rim would fatigue less than others, and the same for those that specialize at the three-point ball. Flipping the leaderboard, the worst players by fatigue over expected were largely low usage role players or young rookies. Again, this made sense given they are not acclimated to high usage roles or just don’t have their legs under them yet. Much more testing was done internally, including year-to-year reliability and the metrics’ relationships with other key stats, all proving successful. Now that the authenticity of the stats is established, let’s look at some of the cooler insights developed.
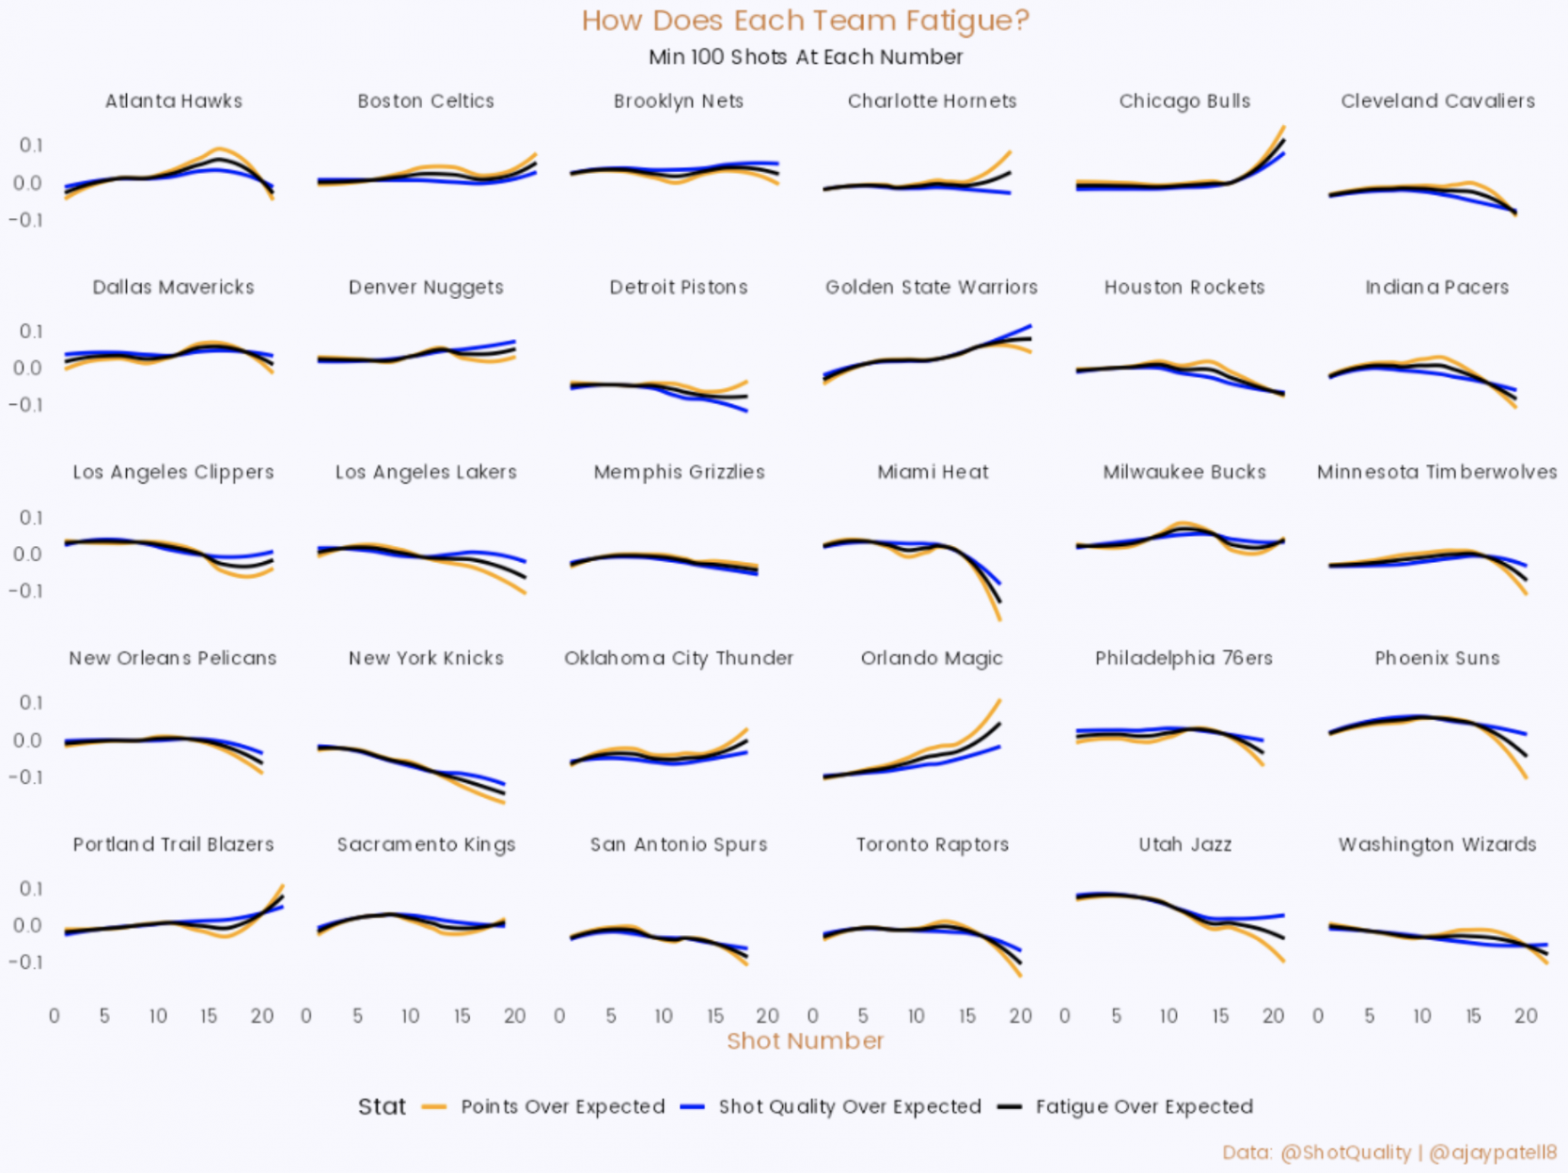
While the metrics are more useful for player-level analysis, taking a look at fatigue by the team was still worthwhile. By first taking a look at each team on offense, we can understand what teams perform better than others when expected to tire.

The recent NBA champions, the Golden State Warriors, stand out in a phenomenal way. Some of it is likely attributed to the players they have, but for the whole team to withstand fatigue as they do is very impressive. The Bulls are also a noticeable outlier, in that they trend positively, like the Warriors. Being able to lean on Demar Derozan and Zach Lavine certainly pays off. However, most teams exhibit a trend that is expected: they start playing worse as the workload increases. It’s natural! The plot below shows the same breakdown but on the defensive side of the ball.

There’s less variance here, which makes sense offenses largely control the outcome. But, some insights are still there for the taking, such as the 76ers giving up more points than expected to players near their fifteen and on shots. Memphis contrasts them, preventing points at a better rate in the same context. Room for further research here remains. Getting this data to teams and comparing their rest/practice routines to see if those have any effect on fatigue would be amazing. For now, though, here’s one more nugget that was astonishing.
The quick turnaround from the 2020 NBA season to the 2021 NBA season was well documented. The off-season period was shortened, and injuries went up. Here’s how it affected fatigue:

Shot Quality over expected had an extremely high correlation to shot number in 2021, especially compared to 2020 and 2022. Fatigue was more common. Although this well could be within the margin of error, it was rewarding to see the data back up a common claim about the 2021 season.
Of course, these metrics were largely developed to analyze each player individually. Instead of spamming player graph after player graph in this article, here’s a link to our NBA Fatigue Shiny app that will let anyone play around with many related graphs and data. Within it, you’ll be able to analyze a player’s performance in the three metrics, check out game-specific data, team-level analysis, compare a player to another, and view a player’s performance by shot number bucket. For example, here’s a comparison graph between two stars in today’s game, Lebron James and Kevin Durant.

Consistently, Durant withstands fatigue better than James, right until that last shot or so. Durant’s one of the best offensive players basketball has ever seen, bringing unreal shotmaking each and every play. He also didn’t have to carry the load as heavily as Lebron did last year with the likes of Kyrie Irving and James Harden as teammates. The context matters here, but on average in the last three years, Durant’s been one of the best in terms of maintaining stamina.
While the article up to this point has covered fatigue pertaining to NBA teams and players, it certainly exists in college as well. Most of the trends mentioned apply just the same to college. The main difference is that college teams play a significantly smaller number of games, helping prevent fatigue over the course of the season. However, within the game, players get tired at a similar rate, if not faster due to general conditioning levels. Take a look at the following graph, which depicts how steep the fall-off can be in college:

The plot is split into two, representing the first and second half, and matches what one might expect. End of game fatigue is real: shotmaking ability plummets in college. And on a shot-by-shot basis, fatigue is even stronger in college than it is in the NBA:

There’s a constant decrease at almost every single step, showing how prevalent fatigue is. While this is much stronger than the NBA equivalent, in general, college fatigue is very similar to the NBA. We do see many more players in college get tired much faster, as opposed to NBA players who can withstand fatigue at a better rate. Maybe that’s just why they’ve made it to the NBA. Of course, there’s much more to be played around with here, which is why our aforementioned NBA Fatigue App and our College Fatigue App were created.
There are many more insights to be drawn here, some of which are being left to you, the reader, but attempting to quantify fatigue has been a longstanding missing piece in basketball analysis, and this work closes the gap.