If you’ve visited the ShotQuality website or followed ShotQuality’s Twitter at any point over the past few years, you’ve probably come across an image that looks like the graphic below at some point:
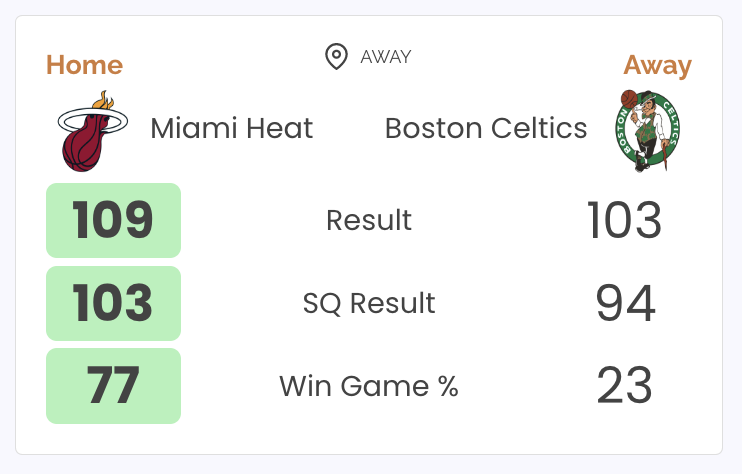
These graphics display three key numbers: the actual score, the ShotQuality expected score, and the probability of each team winning the game given that ShotQuality expected score.
Beginning with the 2022-23 season, ShotQuality is changing the way that third number — win probability — is calculated.
What is the ShotQuality win probability model?
The win probability model is a descriptive model based on the ShotQuality score in an NBA basketball game. It is designed to answer the question “Given the shots attempted by each team in this game, what is each team’s probability of winning the game?”
How does the model work?
The model is based on just one variable: the ShotQuality score differential at the end of the game. For a game where the two teams have an identical expected ShotQuality score, each team is expected to win 50% of the time. As the difference in final ShotQuality scores increases, the probability of each team winning moves further away from 50%.
Other variables were considered for inclusion in the model, most notably total possessions; it was hypothesized that in games with more possessions, the variance between expected and actual final score would increase, and the model would need to be allowed to compensate for this increased variance. However, during model testing these variables did not prove to be significant predictors.
Ultimately, the one-variable model was selected because of its strong performance and interpretability.
How does this approach differ from the previous model?
For the 2020, 2021, and 2022 seasons, a binned model was used to calculate postgame win probabilities at both the college and NBA level. This was fit using historical win probabilities for teams that fell into a ShotQuality margin of victory score bucket — for example, teams that won the ShotQuality score by between 2 and 4 points won, on average, 58 percent of those games.
This model assigned win probabilities for the team that won the ShotQuality score according to the table shown below; the team that lost would have a win probability equal to 1 minus the winner’s win probability. There were only 25 potential win probabilities available to be assigned to teams under this system: 50%, the 12 “positive” win probabilities in the table below, and the 12 inverses of those positive win probabilities (42%, 35%, etc.).

While this approach was broadly acceptable, it did cause some issues. The relatively large width of the bins created confusion — why would a 2-point and 4-point margin of victory each result in a 58% chance of victory, when one of those margins is twice as large as the other?
The percentages also did not always match up with reality. The most obvious example of this is in the “26 or more” bin, where teams were given a 100% chance of victory. Of the 84 games to fall into this bin over the past three seasons, 73 of the teams that won the ShotQuality score won the actual game; a respectable 87% win rate, but pretty far from the 100% suggested by the ShotQuality win probability model.
To address these issues, the new win probability model was created to predict actual win probability from ShotQuality point differential. Data from the 2020, 2021, and 2022 NBA seasons were used to train a logistic regression model. The new model solves the issues with the previous method: it’s a continuous function instead of a binned piecewise function, which means that any increase in point differential will result in a win probability increase, and it’s more accurate to the observed data over the past 3 seasons.
The image below illustrates the differences between the old and new win probability models for NBA games. The old model is shown in red, and the new model is shown in blue.

The same method was used to fit a model for college basketball, using training data from each of the last three seasons. Since college basketball games have, on average, fewer possessions than NBA games — and thus more opportunities for variance — every point of ShotQuality difference matters more in college than in an NBA game.
The table below displays some example scores from the college win probability model:

It’s clear that even a small difference in ShotQuality score carries a heavy weight at the college level. A team that wins the ShotQuality score by five points is expected to win the game 70% of the time in college; in the NBA, that number is just 61%.
Towards an In-Game Win Probability Model
In addition to postgame win probability models, live win probability models that took into account the ShotQuality score for each team as well as the time remaining in the game were fit.
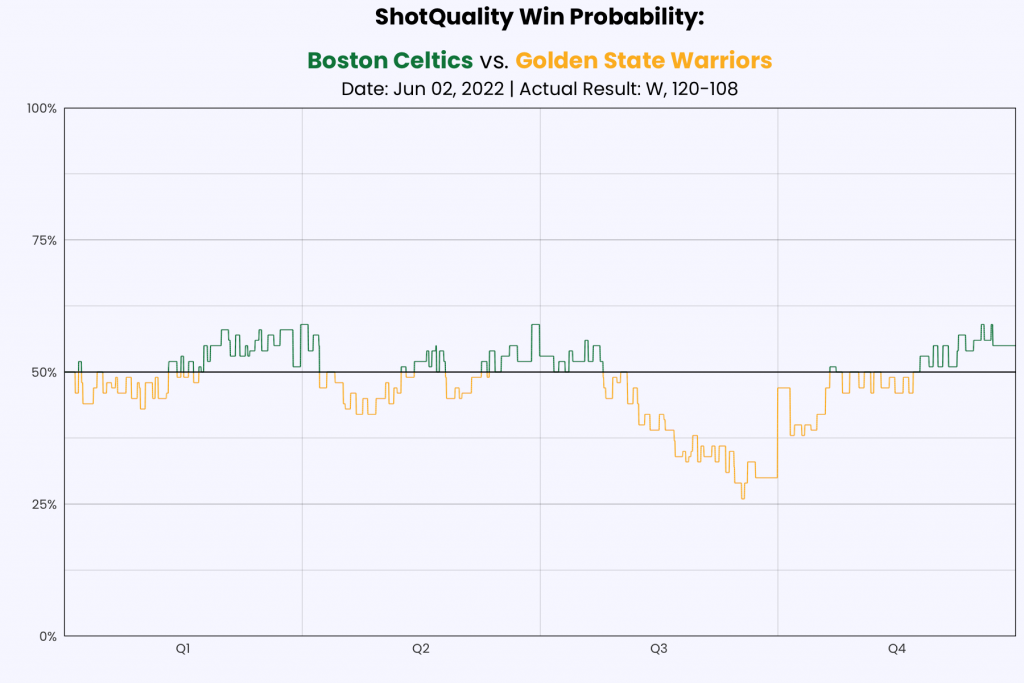
These models showcase the way team shot quality varies over the course of a game. For example, this win-probability chart from Game 1 of the NBA Finals shows the Warriors dominating shot quality in the third quarter but the Celtics clawing their way back in the fourth.
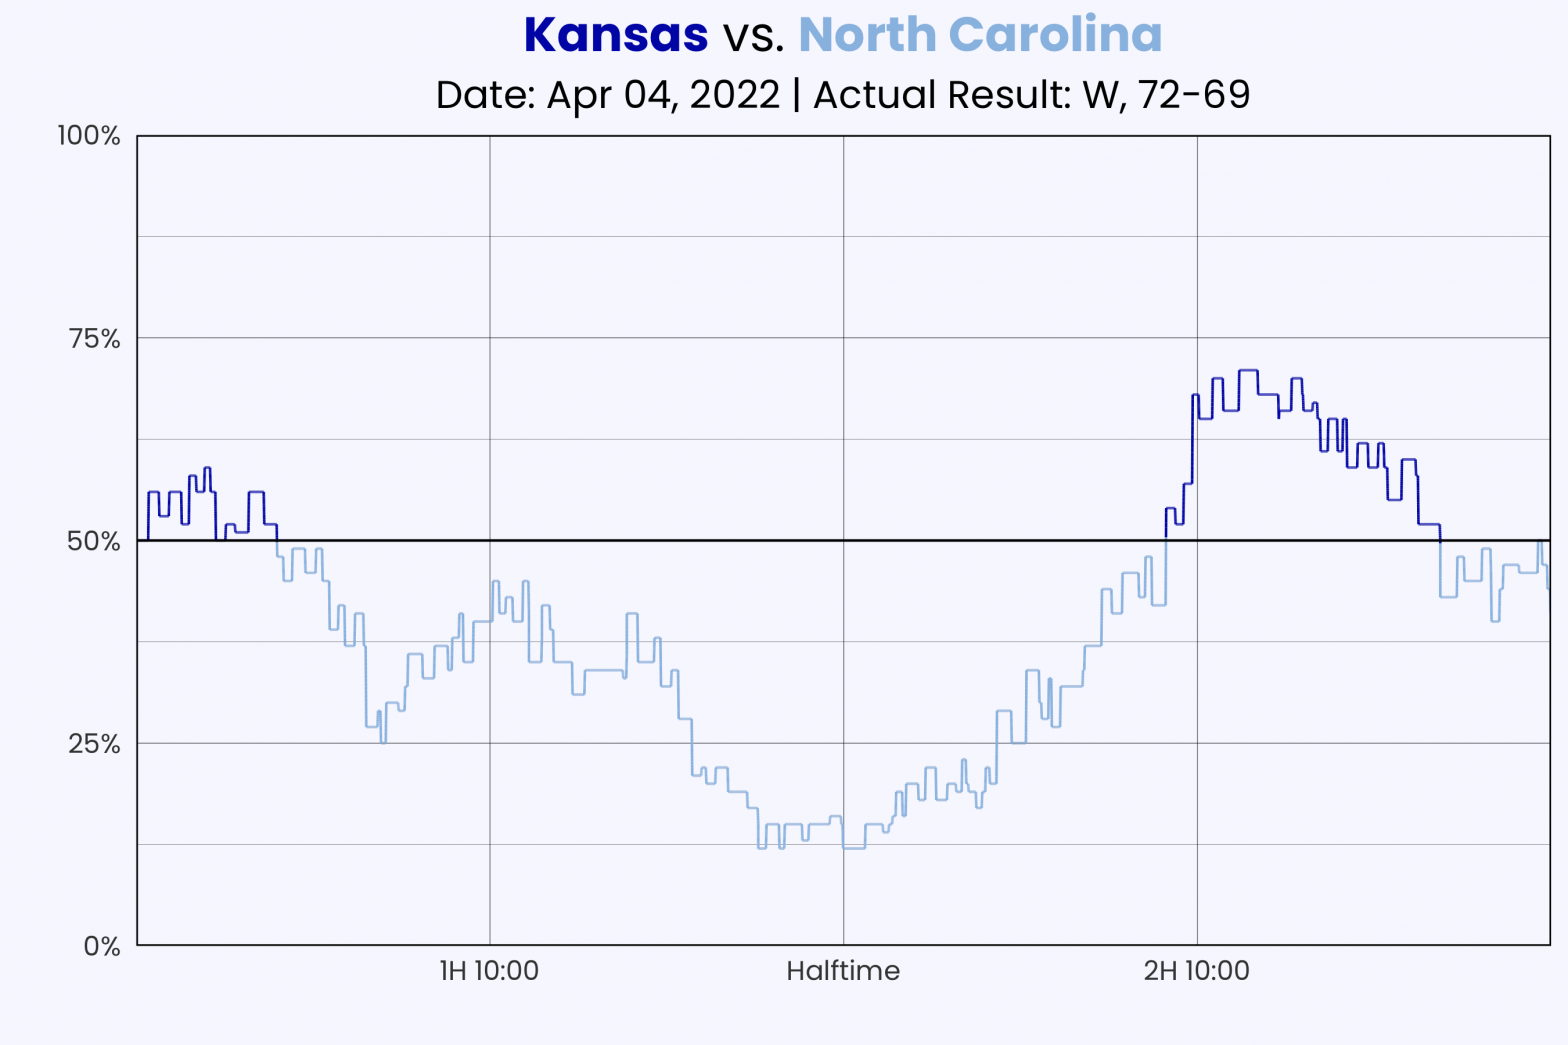
Or in this similar example from the NCAA championship game, North Carolina dominated the quality of shots in the first half — at one point having almost a 90% chance of victory — but Kansas turned it around early in the second half, taking a ShotQuality lead before relinquishing it down the stretch. For such a back-and-forth game, it’s no surprise that the ShotQuality win probability result was just about 50/50.
